
Toolbar
The toolbar is an embeddable debug widget that gets injected directly into your application's HTML pages. It appears as a compact bar at the bottom of the screen, showing key metrics from the current request — response time, memory usage, log count, event count, and more. Click the FAB button to expand it, or open the full debug panel in a new window.
┌─────────────────────────────────────────────────────────────┐
│  Your Application Page                                      │
│                                                             │
│  [page content...]                                          │
│                                                             │
├─────────────────────────────────────────────────────────────┤
│ GET /api/users 200 │ 42ms │ 4MB │ api.users │ 5│ 12│ ⚙ FAB │  ← Toolbar
└─────────────────────────────────────────────────────────────┘Unlike the Debug Panel (a separate SPA at /debug), the toolbar lives inside your application pages — no need to switch windows during development.
How It Works
Injection Flow
When your application returns an HTML response, the adapter's middleware intercepts it and injects a toolbar snippet before </body>:
1. User request → Framework middleware/listener processes request
2. Application generates HTML response
3. Adapter middleware detects text/html Content-Type
4. ToolbarInjector inserts toolbar HTML before </body>
5. Response sent with toolbar embeddedThe injected HTML contains:
- A container
<div id="app-dev-toolbar"> - A
<link>totoolbar/bundle.css - A
<script>with runtime configuration (window['AppDevPanelToolbarWidget']) - A
<script>loadingtoolbar/bundle.js
Data Collection
The toolbar does not collect data itself. It reads data already collected by the Kernel collectors and exposed via the REST API:
Toolbar widget (React)
    │
    ├─ GET /debug/api/           → List of debug entries
    ├─ GET /debug/api/view/{id}  → Full entry data for a collector
└─ GET /debug/api/event-stream → SSE for real-time updatesEach debug entry contains summary metrics (request time, memory, log count, etc.) that the toolbar displays directly without fetching individual collector data.
Real-Time Updates
The toolbar detects new debug entries in two ways:
Service Worker — When registered, the Service Worker intercepts responses and reads the
X-Debug-Idheader. It sends a message to the toolbar, which invalidates its RTK Query cache and refreshes the entry list.SSE (Server-Sent Events) — The debug API streams new entry notifications via
/debug/api/event-stream. The toolbar subscribes to this stream for real-time updates.
Displayed Metrics
When expanded, the toolbar shows these metrics for the selected debug entry:
| Metric | Web | Console | Source |
|---|---|---|---|
| HTTP method + path + status | ✓ | — | entry.request, entry.response |
| Command name + exit code | — | ✓ | entry.command |
| Request time | ✓ | ✓ | entry.web.request.processingTime |
| Peak memory | ✓ | ✓ | entry.web.memory.peakUsage |
| Route name | ✓ | — | entry.router.name |
| Log count | ✓ | ✓ | entry.logger.total |
| Event count | ✓ | ✓ | entry.event.total |
| Validation errors | ✓ | ✓ | entry.validator.total |
| Timestamp | ✓ | ✓ | entry.web.request.startTime |
Layout Modes
The toolbar supports multiple layout modes. Drag it to a screen edge to snap, or drag away to float.
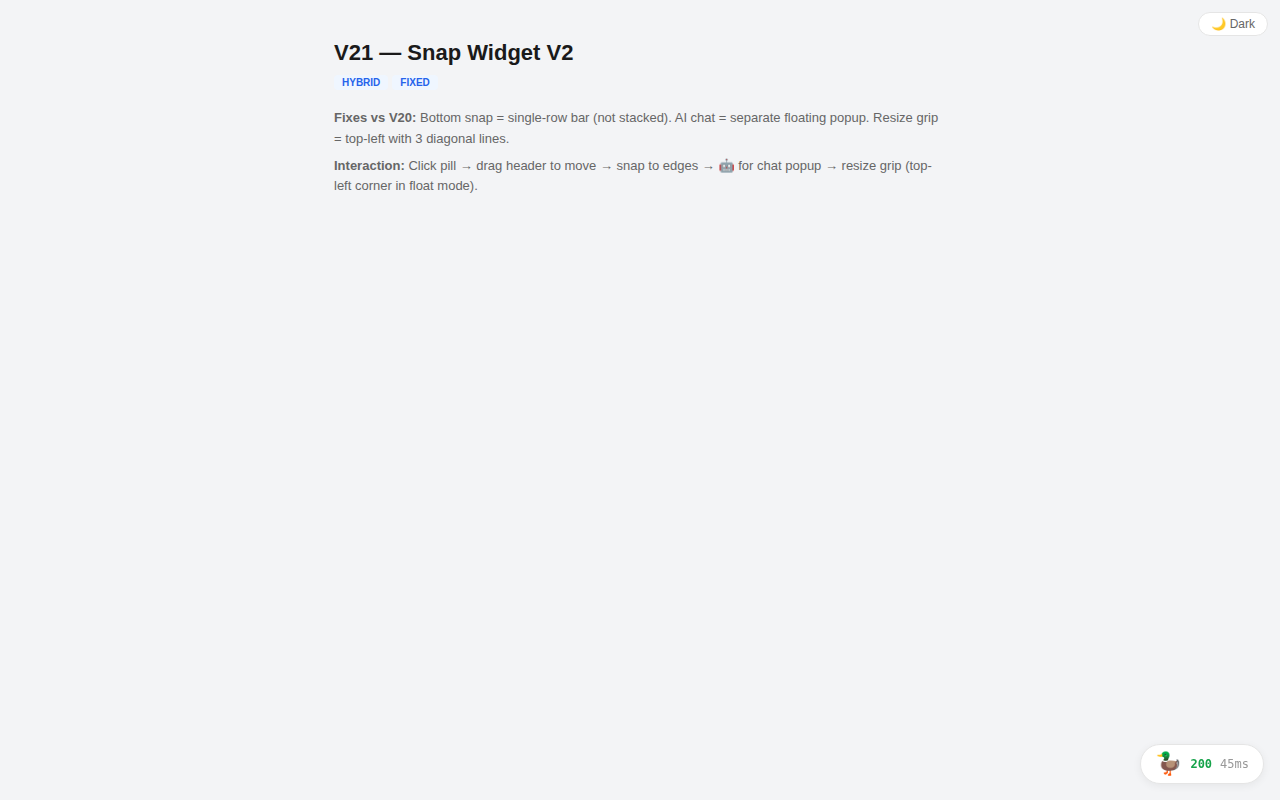
Collapsed Pill
When collapsed, the toolbar appears as a small pill in the bottom-right corner showing the status code and response time. Click to expand.
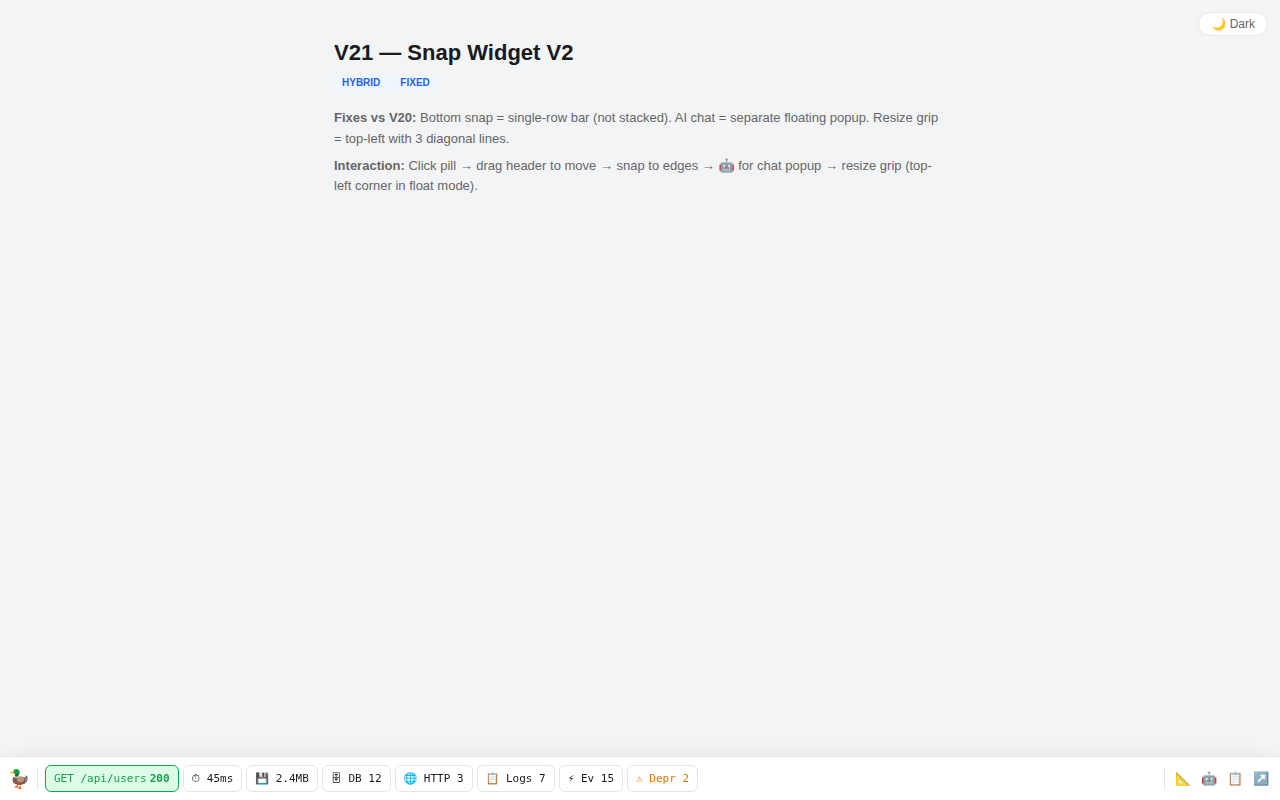
Bottom Bar
The default expanded mode. A single-row horizontal bar at the bottom of the page with all metric chips and action buttons.
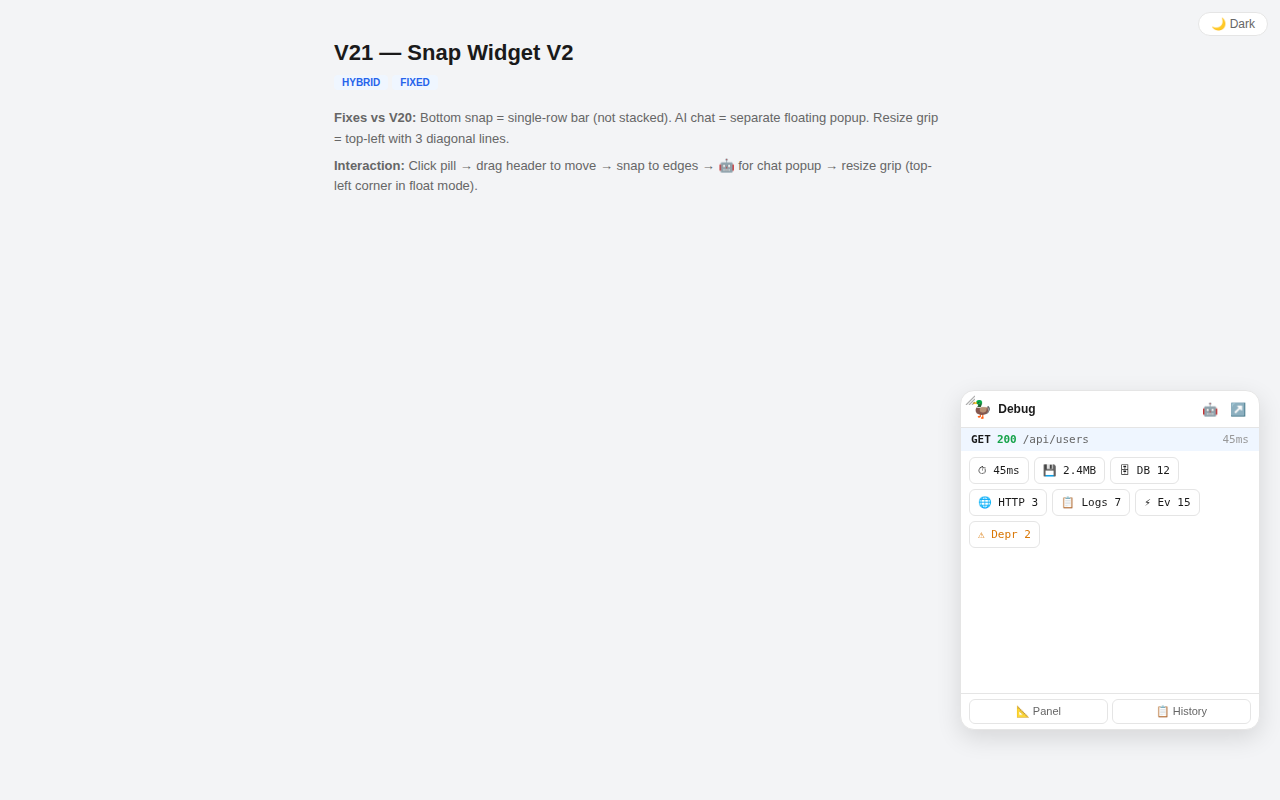
Floating Widget
Drag the toolbar away from the bottom edge to make it a floating card. Includes a request summary bar, wrapped metric chips, and action buttons. Resizable via the top-left grip.
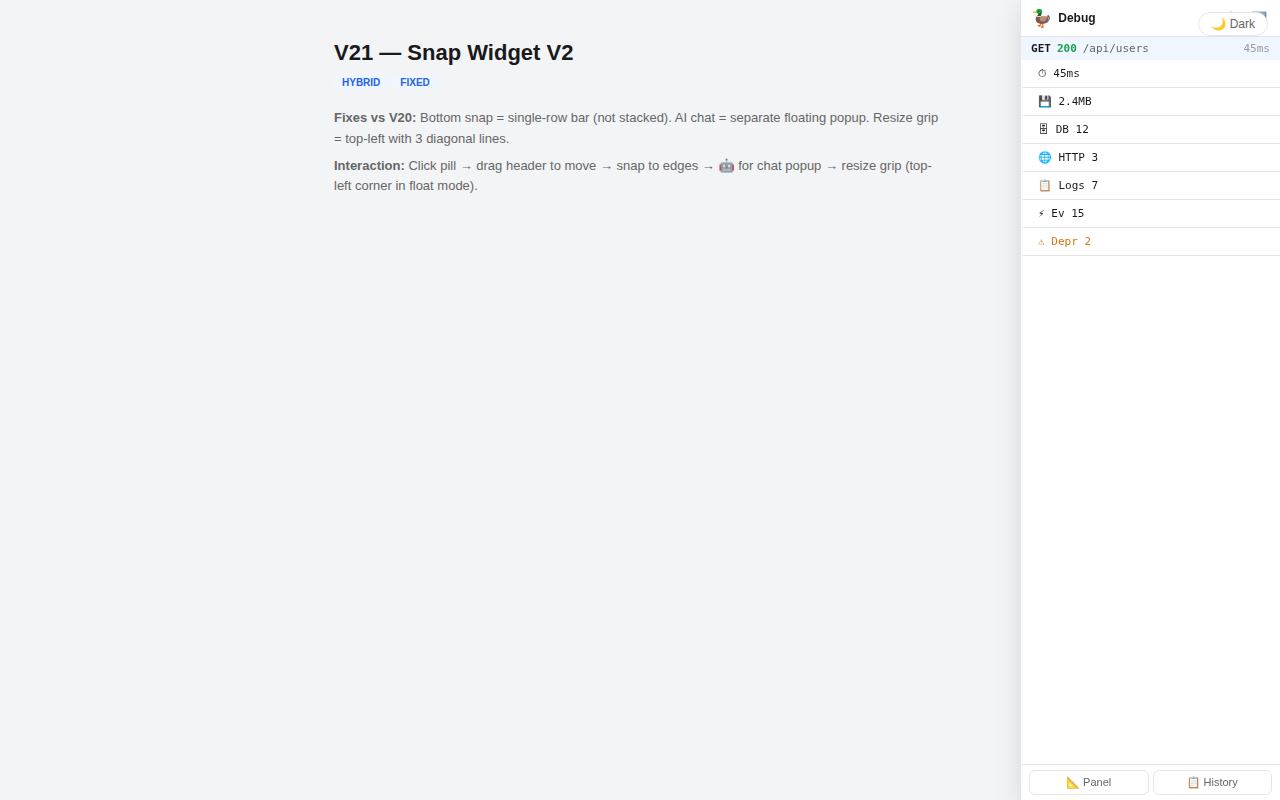
Side Rail
Drag the toolbar to the right or left edge to dock it as a vertical panel. Metrics are displayed as full-width rows with labels and values.
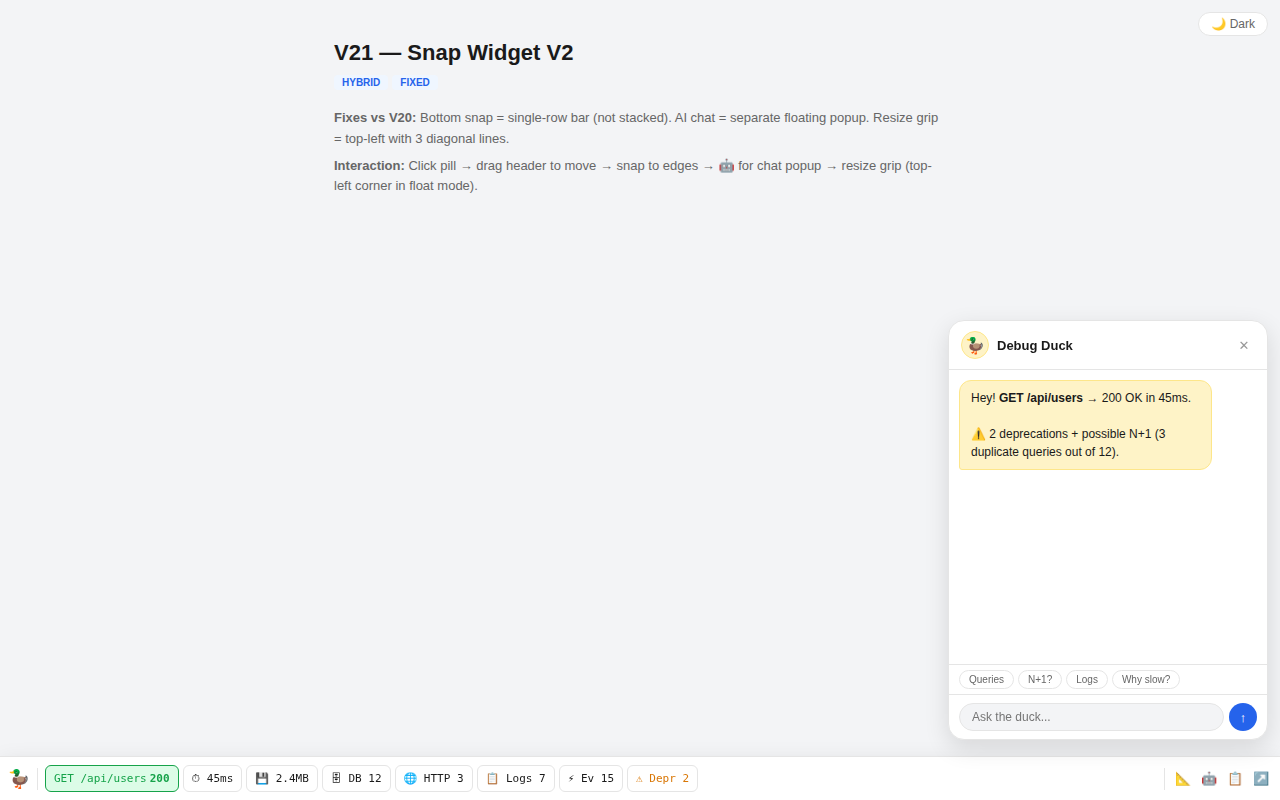
AI Chat
Click the duck icon button to open the Debug Duck chat popup. When an LLM provider is connected, the toolbar sends messages to the backend AI and displays responses inline. The current debug entry's context (request, timing, queries, exceptions) is automatically included, so you can ask questions like "Why is this slow?" without pasting data.
If no provider is connected, the chat shows a warning banner with a link to configure the connection in the panel. See AI Chat for full setup instructions.
Features: multi-turn conversations, suggestion chips, draggable/resizable popup, shared chat history with the panel, connection status indicator.
Snap & Drag
The toolbar position is persisted across page reloads. Drag behaviors:
| From | Action | Result |
|---|---|---|
| Any mode | Drag to bottom edge | Snap to bottom bar |
| Any mode | Drag to right edge | Snap to right rail |
| Any mode | Drag to left edge | Snap to left rail |
| Bottom/Side | Drag away from edge | Float as card |
| Float | Drag top-left grip | Resize widget |
Blue snap zone indicators appear when dragging near screen edges.
Embedded Iframe
When the iframe is enabled (via the Panel button), the toolbar loads the full debug panel inside a resizable iframe at the bottom of the page:
- Entry selection — Selecting an entry in the toolbar navigates the iframe to that entry
- Collector navigation — Clicking a metric chip navigates the iframe to the corresponding collector view
- Resizable — Drag the separator bar to resize the iframe height
Redux State Sync
The toolbar uses redux-state-sync to synchronize state between the toolbar and the main debug panel (if both are open):
toolbarOpen— Whether the toolbar is expandedtoolbarPosition— Current layout mode (bottom, right, left, float)baseUrl— The backend API URL
This ensures consistent behavior when using the toolbar alongside the panel in a separate window.
Configuration
Each adapter supports two toolbar-specific settings:
| Parameter | Default | Description |
|---|---|---|
enabled | true | Inject the toolbar into HTML responses |
static_url | '' (empty) | Base URL for toolbar assets. Empty = uses the panel's static_url |
# config/packages/app_dev_panel.yaml
app_dev_panel:
    toolbar:
        enabled: true
static_url: '' # Uses panel.static_url by defaultDisabling the Toolbar
Set enabled to false to prevent toolbar injection while keeping the rest of ADP active:
app_dev_panel:
    toolbar:
enabled: falseAdapter Integration
The injection mechanism differs per framework, but all use the same ToolbarInjectorAppDevPanel\Api\Toolbar\ToolbarInjector from the API layer.
Symfony
Toolbar injection happens in the HttpSubscriber event subscriber on the kernel.response event (priority -1024). After adding the X-Debug-Id header, the subscriber calls ToolbarInjector::inject() on HTML responses.
The ToolbarInjectorAppDevPanel\Api\Toolbar\ToolbarInjector and ToolbarConfigAppDevPanel\Api\Toolbar\ToolbarConfig are registered as services in the DI container via AppDevPanelExtension.
Laravel
The DebugMiddleware handles injection in its handle() method, after collecting response data and setting the X-Debug-Id header. It checks the Content-Type and calls ToolbarInjector::inject() for HTML responses.
ToolbarConfig and ToolbarInjector are registered as singletons in AppDevPanelServiceProvider.
Yii 3
A dedicated PSR-15 middleware — ToolbarMiddlewareAppDevPanel\Adapter\Yii3\Api\ToolbarMiddleware — handles the injection. It should be placed in the middleware stack after DebugHeaders so the debug ID is available.
Registered in config/di-api.php along with ToolbarConfig and ToolbarInjector.
Yii 2
The WebListener::onAfterRequest() event handler performs the injection. After setting the X-Debug-Id response header, it checks if the response format is HTML and calls ToolbarInjector::inject().
The injector is created via Module::createToolbarInjector() using the module's $toolbarEnabled and $toolbarStaticUrl properties.
Static Assets
Toolbar assets (bundle.js, bundle.css) are served from a toolbar/ subdirectory relative to the panel's static URL:
{static_url}/toolbar/bundle.js
{static_url}/toolbar/bundle.cssWhen using local assets (built with make build-panel), the toolbar bundle is automatically copied into each adapter's asset directory under toolbar/:
libs/Adapter/Symfony/Resources/public/toolbar/bundle.js
libs/Adapter/Laravel/resources/dist/toolbar/bundle.js
libs/Adapter/Yii3/resources/dist/toolbar/bundle.js
libs/Adapter/Yii2/resources/dist/toolbar/bundle.jsDevelopment
The toolbar package has its own Vite dev server on port 3001:
cd libs/frontend/packages/toolbar
npm run start # Starts Vite on http://localhost:3001This serves a standalone page with the toolbar widget for development. Point your adapter to the dev server:
app_dev_panel:
    toolbar:
static_url: 'http://localhost:3001'TIP
The toolbar dev page on port 3001 requires a running backend (default http://127.0.0.1:8080) to fetch debug entries. Without a backend, the FAB button still appears but no metrics are shown.
Architecture
┌──────────────────────────────────────────────────┐
│  User's HTML Page                                │
│                                                  │
│  ┌──────────────────────────────────────────────┐│
│  │  Toolbar React Widget (Portal)               ││
│  │  ├─ SpeedDial FAB                            ││
│  │  ├─ Metric ButtonGroup                       ││
│  │  │   ├─ RequestItem / CommandItem            ││
│  │  │   ├─ RequestTimeItem, MemoryItem          ││
│  │  │   ├─ LogsItem, EventsItem, ValidatorItem  ││
│  │  │   └─ DateItem                             ││
│  │  └─ Embedded iFrame (optional, resizable)    ││
│  └──────────────────────────────────────────────┘│
└──────────────────────────────────────────────────┘
         │ HTTP                              │ postMessage
         ▼                                   ▼
┌─────────────────┐              ┌─────────────────┐
│  Debug REST API │              │  Debug Panel    │
│  /debug/api/*   │              │  (in iframe)    │
└─────────────────┘ └─────────────────┘Source code: libs/frontend/packages/toolbar/ (React widget), libs/API/src/Toolbar/ (PHP injector)