
WebAppInfo Collector
Collects web application performance metrics — request processing time, preload time, emit time, memory usage, and adapter name.
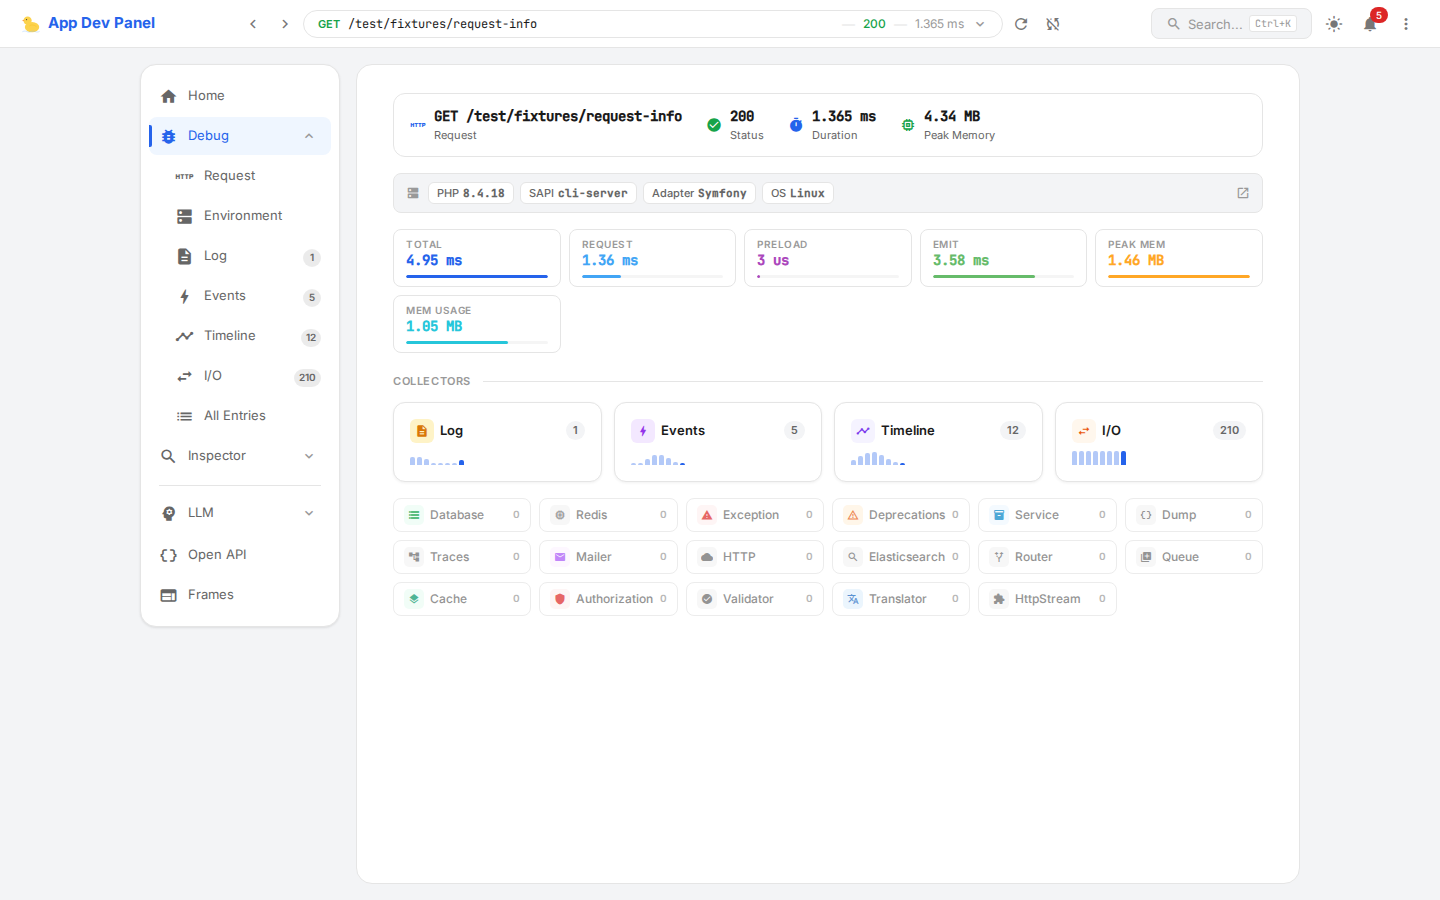
What It Captures
| Field | Description |
|---|---|
applicationProcessingTime | Total application processing time |
requestProcessingTime | Request handling time |
applicationEmit | Response emit time |
preloadTime | Bootstrap/preload time |
memoryPeakUsage | Peak memory usage in bytes |
memoryUsage | Current memory usage in bytes |
adapter | Framework adapter name |
Data Schema
{
    "applicationProcessingTime": 0.045,
    "requestProcessingTime": 0.032,
    "applicationEmit": 0.001,
    "preloadTime": 0.012,
    "memoryPeakUsage": 8388608,
    "memoryUsage": 6291456,
    "adapter": "symfony"
}Summary (shown in debug entry list):
{
    "web": {
        "adapter": "symfony",
        "request": {
            "startTime": 1711878000.100,
            "processingTime": 0.032
        },
        "memory": {
            "peakUsage": 8388608
        }
    }
}Contract
use AppDevPanel\Kernel\Collector\Web\WebAppInfoCollector;

$collector->markApplicationStarted();
$collector->markRequestStarted();
// ... request processing ...
$collector->markRequestFinished();
$collector->markApplicationFinished();INFO
WebAppInfoCollectorAppDevPanel\Kernel\Collector\Web\WebAppInfoCollectorCollects Web App Info data during application lifecycle. implements SummaryCollectorInterfaceAppDevPanel\Kernel\Collector\SummaryCollectorInterfaceSummary data collector responsibility is to collect summary data for a collector. Summary is used to display a list of previous requests and select one to display full info. Its data set is specific to the list and is reduced compared to full data collected in {@see CollectorInterface}. and depends on TimelineCollectorAppDevPanel\Kernel\Collector\TimelineCollectorCollects Timeline data during application lifecycle.. Located in the Web sub-namespace.
How It Works
Framework adapters call the mark*() methods at key points in the request lifecycle — application boot, request start, request end, and response emit. Memory metrics are captured via memory_get_peak_usage() and memory_get_usage().
Debug Panel
The WebAppInfo data is displayed in the top bar of every debug entry as processing time and memory usage, rather than having a dedicated panel.